Employability and careers: Destinations
Where our students go
Alumni
Destination Data
Is used to help us develop and improve our careers programme to improve outcomes for our young people
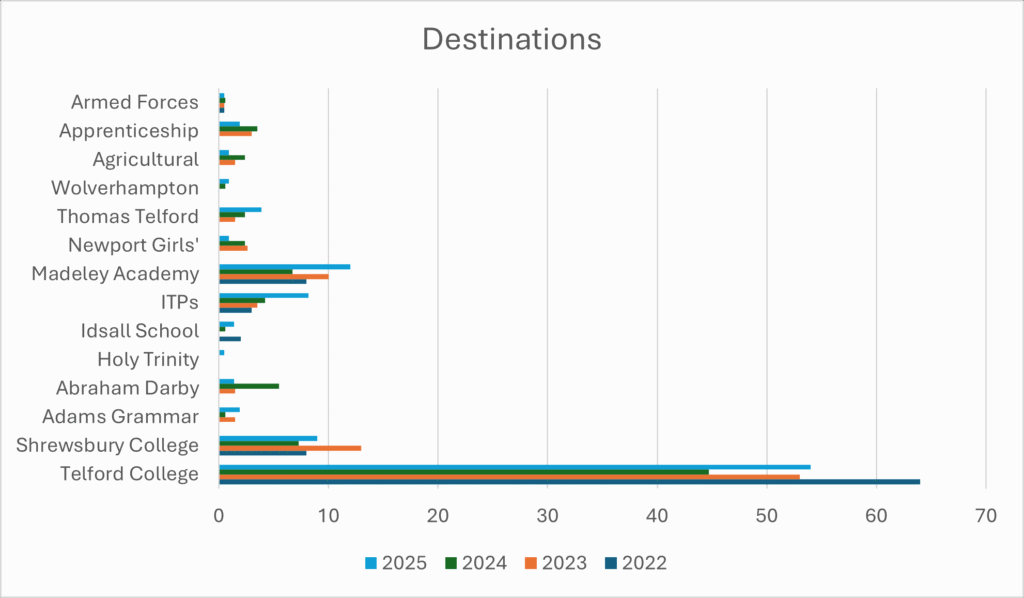
Below is an indication of the destinations of students.
| Destination | 2025 | 2024 | 2023 | 2022 | 2021 | 2020 |
|---|---|---|---|---|---|---|
| FTE | 92.1% | 84.8% | 88.5% | 90.5% | 95% | 91.7% |
| Apprenticeships | 2.2% | 2.2% | 2.6% | 0% | 0.5% | 2.7% |
| Employment/Training | 0% | 4.3% | 1.8% | 2.8% | 1.4% | 1.7% |
| Reengagement | 2.6% | 0.5% | 3.5% | 0.7% | 1.8% | 0% |
| NEET | 2025 | 2024 | 2023 | 2022 | 2021 | 2020 |
|---|---|---|---|---|---|---|
| Actively Seeking | 0.9% | 3.3% | 1.8% | 2% | 0.5% | 1.7% |
| Not Active | 2.2% | 3.3% | 1.3% | 2% | 0.5% | 2.8% |
| Moved Out Of Area | 0% | 0% | 0% | 0% | 0% | 0% |
| Situation Not Known | 0% | 1.6% | 0.4% | 2% | 0% | 0% |